Check out the Sankey Diagram Generator I have just made. It supports self loops, moving around nodes in both horizontal and vertical directions and loading and saving diagrams! You can also change the opacity and the density of the links.
Use the Load/Save button to edit/create complex Sankey’s.
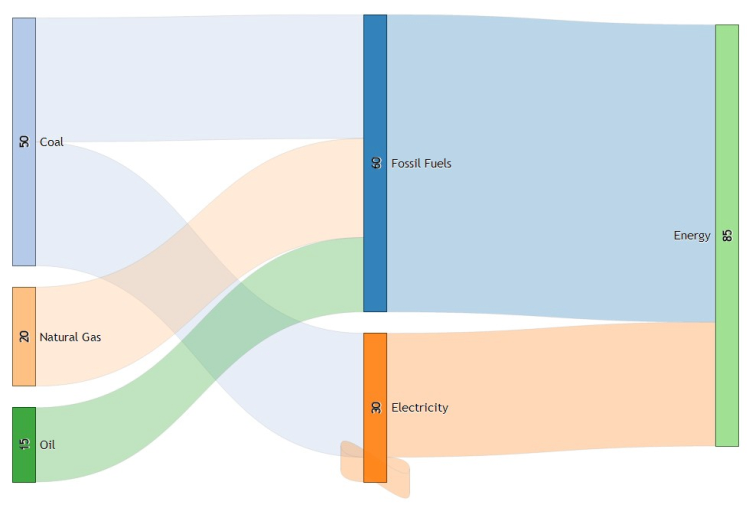
The source code for the Sankey displayed above is:
{"nodes":[{"name":"Oil"},{"name":"Natural Gas"},{"name":"Coal"},{"name":"Fossil Fuels"},{"name":"Electricity"},{"name":"Energy"}],"links":[{"source":0,"target":3,"value":15},{"source":1,"target":3,"value":20},{"source":2,"target":3,"value":25},{"source":2,"target":4,"value":25},{"source":3,"target":5,"value":60},{"source":4,"target":5,"value":25},{"source":4,"target":4,"value":5}]}
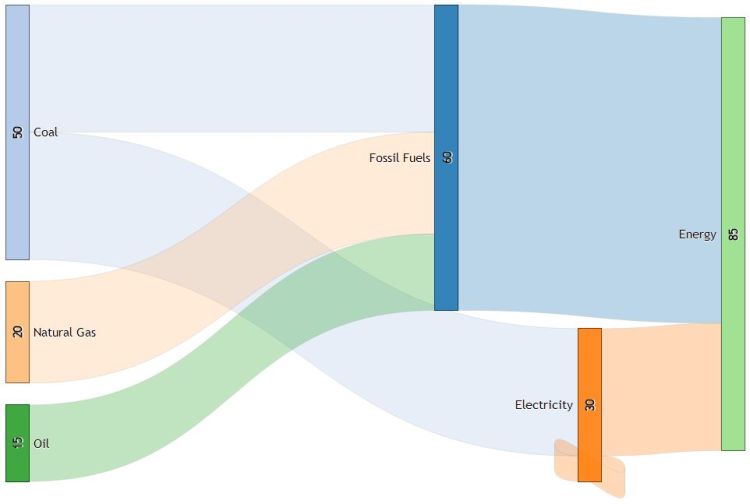
You can also use the keyword layer to create nodes fixed along the x-axis. In the above example, if you use “layer”: 3 for the node Fossil Fuels and “layer”:4 for Electricity, they will not be aligned, with the latter being placed to the right of the former.
{"nodes":[{"name":"Oil"},{"name":"Natural Gas"},{"name":"Coal"},{"name":"Fossil Fuels","layer":3},{"name":"Electricity","layer":4},{"name":"Energy"}],"links":[{"source":0,"target":3,"value":15},{"source":1,"target":3,"value":20},{"source":2,"target":3,"value":25},{"source":2,"target":4,"value":25},{"source":3,"target":5,"value":60},{"source":4,"target":5,"value":25},{"source":4,"target":4,"value":5}]}
You can also fix the size of a node using the keyword value.
{"nodes":[{"name":"Oil"},{"name":"Natural Gas"},{"name":"Coal"},{"name":"Fossil Fuels","layer":3,"value":10},{"name":"Electricity","layer":4},{"name":"Energy"}],"links":[{"source":0,"target":3,"value":15},{"source":1,"target":3,"value":20},{"source":2,"target":3,"value":25},{"source":2,"target":4,"value":25},{"source":3,"target":5,"value":60},{"source":4,"target":5,"value":25},{"source":4,"target":4,"value":5}]}

UDPATE: Using the keyword fill, you can also color the nodes (and automatically their links).
{"nodes":[{"name":"Oil"},{"name":"Natural Gas"},{"name":"Coal","fill":"black"},{"name":"Fossil Fuels","layer":3,"value":10},{"name":"Electricity","layer":4},{"name":"Energy"}],"links":[{"source":0,"target":3,"value":15},{"source":1,"target":3,"value":20},{"source":2,"target":3,"value":25},{"source":2,"target":4,"value":25},{"source":3,"target":5,"value":60},{"source":4,"target":5,"value":25},{"source":4,"target":4,"value":5}]}

UDPATE 2: Today the Sankey Diagram Generator got a major update: I have been working on the load and save functions to include the layout. Another minor update is that now you can toggle the node labels (both the text and values) on/off. On top giving you the option to save the Sankey structure and layout, now you can also save the diagram as a PNG image.
Now, when trying to save the Sankey code, a checkbox shows up next to the Done button, giving you the option to save the Sankey layout for loading later. This includes the node and link positions, as well as the settings for opacity and density. This is a major milestone as it has been a headache to redesign Sankeys, as previously only the structure was saved but not the layout. On the save screen now you also have the option to download the diagram as image.
As a result of these modifications, the Sankey save string changed a little bit in structure. In order to preserve background compatibility, the Sankey structure code – which made up the entirety of the save string up until now – was put under the key “sankey“, the parameters on whether to display labels, density and opacity under the key “params” and finally, the layout, if selected, under “fixedlayout“. Subsequently, when loading back the Sankey save string you are given the option to try to read the layout from the string. If you do not provide the layout, or you choose to ignore it (via a checkbox next to the Done button), the algorithm computes the layout for you automatically, as before. The structure of the “fixedlayout” key is a set of coordinates [x,y] for each of the nodes. So a fixedlayout string in the form of [[0,30],[0,20],[10,50]] will have 3 nodes, the first placed at x=0,y=30 on the screen, the second at 0,20 and so on. These are pixel values starting in the top left corner.
UDPATE 3: Some users have requested to be able to create Sankeys with multiple flows between the same two nodes. This can be interpreted as having parallel links. While with a small number of parallel links, this is not a problem, the relaxation algorithm fails to lay out the links correctly in case of many. This algorithm is at the core of the rendering and therefore hard to change as it is designed to optimize the layout in general (minimize the total link path length in the connected component). However, I have included an experimental feature to correctly display Sankeys with many parallel links – this will not necessary offer the best layout for regular Sankeys though. In the sankey.js, there is a function called computeLinkDepths which sorts the links in ascending order at the sources and subsequently at the targets. This leads to some ordering conflicts (two source nodes going to the same target, with links of different value, will not both have their top link at the top at the target), which are then solved be the least in number. In case of parallel links, this creates a messy layout. To solve this, I have included a toggle for parallel rendering. This is a bit of an advanced feature and I encourage you to try to understand the sankey.js code structure before you turn this on. How to turn it on? First, make sure that in your input string all parallel links are sorted by value and grouped by source node. An example of this would be:
{"sankey":{"nodes":[{"name":"a"},{"name":"b"},{"name":"c"},"name":"d"}],"links":[{"source":0,"target":1,"value":10},{"source":0,"target":1,"value":70},{"source":0,"target":1,"value":80},{"source":0,"target":1,"value":100},{"source":0,"target":1,"value":200},{"source":0,"target":1,"value":700},{"source":0,"target":1,"value":800},{"source":0,"target":2,"value":20},{"source":0,"target":2,"value":30},{"source":0,"target":2,"value":40},{"source":0,"target":2,"value":300},{"source":0,"target":2,"value":400},{"source":0,"target":3,"value":60},{"source":0,"target":3,"value":600},{"source":2,"target":3,"value":50}]},"params":[0.5,0.25,0,0]}
.Then open up a console in your browser and turn on parallel rendering by typing the following:
parallelrendering=true
Then hit the Draw Sankey button to redraw the diagram and you should be seeing your Sankey with many parallel links loaded correctly. You can turn it off either by refreshing the page or setting it back to false in the console. Have fun!
UDPATE 4: Added option for adjusting decimals for nodes and links, as well a counter for the node editor on the right, making it easier to create larger diagrams.
UPDATE 5: Sankey Diagram Generator is now on GitHub.
Made with D3.js & Dragdealer. If you would like to show your support for my work, please consider a small donation. For a more advanced, applied implementation of this tool, see the Food Energy Flows Exploratorium.
![]()


Nice job, thanks for share it.
LikeLiked by 1 person
hey. I’m using your sankey diagram generator to create nice sankeys for a thesis. I’m wondering if it is possible to change the colors? have a nice evening
LikeLike
Hi Flavio! You can now! Just use the fill keyword on the node definition dictionary for the nodes that you want to have a fixed color, such as “fill”:”black” or “fill”:”#ff4411″. Others will take a random color. I’ve updated the main post too to illustrate this.
LikeLiked by 1 person
Thank you Dénes! It’s a really great tool you created. I’ll cite you in the work 🙂
LikeLiked by 1 person
Thank you for sharing the job. I am wondering that is it possible to change the flow’s color?
LikeLike
This is possible now, just use fill like for nodes.
LikeLike
Hi Zhou. In the food.js file from the webpage, look at line 138 (g.attr). That controls the flows’ colro, currently set to be defined by the source node. You can change it there for the target or a fixed color, or include a separate field in the JSON of your flows, if you would like to have custom colored flows for many diagrams.
LikeLike
Awesome! Thanks for your sharing. I was wondering how can I set custom colored flows by indicating separate field in the JSON string? Thanks again!
LikeLike
This is possible now, just use fill like for nodes.
LikeLike
Hi
I would like to link a zone, let’s say value 1, to another zone of value 1.5 to the right. when i do that, the entire zone is not covered since it is covering the same area or less
LikeLike
Hi, I am not sure I understand what you mean by zones..?
LikeLike
Hi, thank You so much for share it. I’m just testing your sankey diagram generator to create saving diagrams in my plant. I’m wondering if it is possible to change direction in to saving view. Left side Electricity and right side for e.g. Light, motors etc.
LikeLike
Hi KZ! For now, you would have to enter the data backwards, as there is no reverse display option. If you are handy with Javascript, it is possible to edit the sankey.js file and negate the x coordinates of nodes : )
LikeLike
Hello!
I tried using this, but if I enter many values for the same source and target, they are not grouped anymore but split up in many single lines that even cross each other, so it does not look like a normal sankey anymore. Do you have the same problem?
LikeLike
Hi Laura, Sankey Diagrams by default can have only one flow between nodes. However, this one does support multiple flows. Try to load this code to see:
{"sankey":{"nodes":[{"name":"Oil"},{"name":"Natural Gas"},{"name":"Coal","fill":"seaGreen"},{"name":"Fossil Fuels","value":65,"layer":2},{"name":"Electricity","layer":2},{"name":"Energy","fill":"grey"}],"links":[{"source":0,"target":3,"value":15},{"source":1,"target":3,"value":20},{"source":2,"target":3,"value":25},{"source":2,"target":4,"value":25},{"source":3,"target":5,"value":60},{"source":4,"target":5,"value":25},{"source":4,"target":4,"value":5},{"source":2,"target":4,"value":2},{"source":2,"target":4,"value":2},{"source":2,"target":4,"value":2}]},"params":[0.5,0.25,0,0]}LikeLike
Thank you for your fast answer 🙂 Could you please try this:
{“sankey”:{“nodes”:[{“name”:”a”},{“name”:”b”},{“name”:”c”},{“name”:”d”}],”links”:[{“source”:0,”target”:1,”value”:100},{“source”:0,”target”:1,”value”:10},{“source”:0,”target”:1,”value”:200},{“source”:0,”target”:2,”value”:20},{“source”:0,”target”:2,”value”:300},{“source”:0,”target”:2,”value”:30},{“source”:0,”target”:2,”value”:400},{“source”:0,”target”:2,”value”:40},{“source”:2,”target”:3,”value”:50},{“source”:0,”target”:3,”value”:600},{“source”:0,”target”:3,”value”:60},{“source”:0,”target”:1,”value”:700},{“source”:0,”target”:1,”value”:70},{“source”:0,”target”:1,”value”:800},{“source”:0,”target”:1,”value”:80}]},”params”:[0.5,0.25,0,0]}
LikeLike
As a temporary workaround, try to sort your keys, such as
{"sankey":{"nodes":[{"name":"a"},{"name":"b"},{"name":"c"},{"name":"d"}],"links":[

{"source":0,"target":1,"value":10},

{"source":0,"target":1,"value":70},

{"source":0,"target":1,"value":80},

{"source":0,"target":1,"value":100},

{"source":0,"target":1,"value":200},

{"source":0,"target":1,"value":700},

{"source":0,"target":1,"value":800},

{"source":0,"target":2,"value":20},

{"source":0,"target":2,"value":30},

{"source":0,"target":2,"value":40},

{"source":0,"target":2,"value":300},

{"source":0,"target":2,"value":400},

{"source":0,"target":3,"value":60},

{"source":0,"target":3,"value":600},

{"source":2,"target":3,"value":50}]},

"params":[0.5,0.25,0,0]}
This is still not perfect, but almost there.
LikeLike
I see – yeah, you’re right. Currently I’ve only tried it with a small number of parallel links (3-4), After that the relaxation algorithm just messes things up. I’ll try to lay them out nicely when I’ll have some time. For now you can try to group them into parallel flows of 3 or 4. Or if you’re adventurous, edit the code and see where it goes!
LikeLike
Okay. I tried to but I am a very beginner, so it would be great if you or someone who reads this could help me eventually.
LikeLike
Hi Laura – please see UPDATE 3 in the main text.
LikeLike
Hi Denes, Good work, thankyou. I don’t think the “save layout” option is doing anything at the moment.
LikeLike
Hi Natt, click on “save layout” an additional key named “fixedlayout” should be added to the Sankey save string, with an array of [x,y] coordinates as the layout. Seems to be working for me..
LikeLike
Hi Denes, using your work quite frequently now. Can you add an export image function, or is there one that I am missing? I can print screen and edit elsewhere, but Sankeymatic for example offers the option to export to a larger PNG.
LikeLike
Nat, if you open the Save Tab, there is a link called Save Image. Doens’t fully preserve the fonts because of SVG/CANVAS problems, but it still looks good. And now you can include teh layout too in your sankey save string, so bascially you can recreate everything exactly as you left it. Cheers. Denes
LikeLike
UPDATE: now it should preserve the fonts, too!
LikeLike
Hello! The Sankey is displayed correctly now, with grouped bows. Thank you 🙂 (Only in Chrome it is still different.)
LikeLiked by 2 people
Hello Dénes,
first thank you very much for your great documentation and help here. But of course I also have a question.
I do have many flows in one Sankey Chart with very different values. So I have now the problem, that the vertically displayed values in the nodes are larger than the nodes and are overlapping each other. Is there an easy possibility to display the values directly besides the node label horizontally outside the nodes in regular style like node label?
E.g. like in your example: “Coal; 50” or something like this.
I’m not so handy with javascript yet so I would be happy about help 🙂
LikeLike
Hey Simon, this is not hard, but it does require javascript….What you need to do is to run the Sankey Diagram generator locally (I explain on this blog in a post called How to make a d3js visualization how to do this), then edit the http://sankey.csaladen.es/js/food.js file. In this file, lines 228-248 you will find the node label controls. Here, the first text element is the node value, and you can see where it is roated (“transform”, “rotate(270)”) and that the label is only displayed if its height (dy) is above 50 pixels. Try to play with these, you can remove the rotation or move the label around by adjusting its x or y coordinates. The other text element – you guessed it – is the node name. Cheers.
LikeLike
Was wondering whether it’s show two decimal places for the node values.
LikeLiked by 1 person
You can now! – I just added this feature 😉
LikeLike
Hello Denes, great tool, thanks for making it public. Quick question: if I try to add more than 14 nodes the diagram won’t render. Is there a limit, or am I possible doing something incorrectly?
LikeLike
{"sankey":{"nodes":[{"name":"Oil"},{"name":"Natural Gas"},{"name":"Coal","fill":"seaGreen"},{"name":"Fossil Fuels","value":65,"layer":2},{"name":"Electricity","layer":2},{"name":"Energy","fill":"grey"},{"name":"New Node"},{"name":"New Node"},{"name":"New Node"},{"name":"New Node"},{"name":"New Node"},{"name":"New Node"},{"name":"New Node"},{"name":"New Node"},{"name":"New Node"},{"name":"New Node"},{"name":"New Node"},{"name":"New Node"},{"name":"New Node"},{"name":"New Node"}],"links":[{"source":0,"target":3,"value":15},{"source":1,"target":3,"value":20},{"source":2,"target":3,"value":25},{"source":2,"target":4,"value":25},{"source":3,"target":5,"value":60},{"source":4,"target":5,"value":25},{"source":4,"target":4,"value":5},{"source":0,"target":14,"value":0.52},{"source":0,"target":13,"value":0.52},{"source":0,"target":12,"value":0.52},{"source":0,"target":11,"value":0.52},{"source":0,"target":10,"value":0.52},{"source":0,"target":9,"value":0.52},{"source":0,"target":8,"value":0.52},{"source":0,"target":7,"value":0.52},{"source":0,"target":6,"value":0.52},{"source":0,"target":17,"value":0.52},{"source":0,"target":18,"value":0.52},{"source":0,"target":19,"value":0.52},{"source":0,"target":16,"value":0.52},{"source":0,"target":15,"value":0.52}]},"params":[0.75,0.25,0,0]}This has more than 14 and it seems to be working fine for me… Can you check if this works on your side?LikeLike
i wonder whether the concrete number of the links can be shown on the diagram
LikeLiked by 1 person
Huang, it’s your lucky day. I added a new checkbox called “count” under the “Label nodes:” menu item. Cheers!
LikeLike
Hello, like I wrote in July, the grouping is working in all browsers, except Chrome. Why is that so that the browser makes such a difference here?
LikeLike
Hi Laura, I have no idea. But cross-browser testing is definitely past my efforts for this open-source pasttime project 🙂
LikeLike
I have a parameterized URL (date ranges) that creates the JSON dynamically and I can copy & paste to load it manually no problem (it looks GREAT! Thanks for all of your work on this.), but I’m not sure how to load my data by default. Can you provide an example?
LikeLike
HI James – thanks for the nice words. You will need to run the Diagram Generator locally for that.. I don’t use cookies, therefore cant really remember your data..
LikeLike
This is an awesome tool! Thank you. When entering data, how do I keep information in the vertical order I need it to show proper flows of work?
LikeLike
Can you explain a bit more?
LikeLike
Hi Denes,
Thanks for this useful tool.
I’m experiencing a similar issue to Joe where the program sometimes displays nodes in a different order to how they have been entered in the code in the generated sankey diagram. An example is where I have nodes that need to be displayed in a specific order in a layer (i.e. Category 1, Category 2, Category 3, etc in layer 2) the generated sankey diagram displays them in a different order (i.e. Category 2, Category 3, Category 1). Is there anyway to lock the vertical hierarchy of nodes so that the sankey diagram is displayed as intended?
Also, is there any storage of data when using this program?
Thanks,
John
LikeLike
Hi John – the node order depends on the node layout optimization algorithm, so it is not always in the same order as you enter them. The only way to do that currently is to move the nodes manually, then saving the layout.
No data is stored – only if you have created a diagram, you close the page and return, it gets loaded from localStorage, your browser’s cache memory.
LikeLike
Hi,
I was wondering if its possible to have 4 layers.
Also as far as I can tell that 10 is the maximum number of nodes. Is this correct?
LikeLike
Hi waterlogger, the number of layers and nodes is unlimited. Let me know if you need help.
LikeLike
Hey, thanks, this is an awesome tool! I think I’m having a font issue tho, the values that show on the nodes are coming up as a outline fonts which don’t display well at lower resolutions. If I have a corrupt font, could you tell me what font it is to look for?
Also, I couldn’t figure out how to force it to display all values on nodes, some of the smaller values don’t display when they are too small, but I’d still like to have that option.
Thanks again for an awesome tool! I made an excel sheet to (slightly) automate writing the code.
LikeLiked by 1 person
Hey aaronmichels2014, I’ll add these functions in a day or two, great suggestions, thanks! I’ll add a font selector. The node value display is currently hard-coded, so let me make a parameter out of it quickly.
LikeLiked by 1 person
Open up a console, and set
minnodewidth=0or 1, or what you’d like. Then click to draw the diagram again. By default this is set 50, so everything with a height below 50 pixels won’t have a label. Cheers!LikeLiked by 1 person
Thanks!
LikeLike
Awesome. Thanks for the minnodewidth parameter.
Another question I had, I’m trying to make a number of different Sankeys where the width of a node with a certain value is consistent between renderings. Could you give me a hint toward understanding how you determine width with density? For example, I want to generate 1 sankey where the 1st layer nodes total 1000, and then a second sankey where the first layer nodes total 500, but where the 500 is the same width as half of the 1000 in the first sankey. I was trying to put in an additional “spacer” node to compensate for resizing, but I’m not quite understanding how you determine density when all of the layers are changing.
Thanks again,
Great tool!
LikeLike
Hey again – the layout unfortunately is calculated to fill the whole screen, therefore it would require some coding to have a “fixed size” across multiple renderings. Not impossible, I’ll add it to the todo list. BTW, you can add it too, on GitHub.
LikeLike
Love the tool! Any suggestions about who to do if the diagram is off the screen? I can’t see the end of the nodes to drag and drop. I tried the ‘save image’ function but that is also off the screen.
LikeLike
Hi Taylor – can you post a screenshot?
LikeLike
This is really excellent. A quick Q, however: the “load” function doesn’t seem to be working when I copy & paste the string in.
I also could not move around the order of the nodes (perhaps because I had a lot of data?)
These could all very well be my own browser/computer issues.
Many thanks for your time!
LikeLike
Hi Stephen, size of data shouldn’t be a problem. However, if you’ve checked for all commas, dots, etc and it’s all OK, a lot of times what break is it the parenthesis and the quote character.Make sure you use exactly these characters: ( ) ” and not their very visually similar but different ASCII versions. Sometimes location-settings of the browsers mess with these…
LikeLike
Hi there, great product. I have two questions (potentially/likely of my mistake):
1. I lost the ability to re-order the nodes once I reached a certain number. I couldn’t drag & drop them like I used to in the fossil fuel sample provided.
2. I was able to save my string code, but once I tried to load it, nothing appeared — it just stayed at the sample fossil fuel example.
Much appreciated for your time!
-Stephen
LikeLike
hey Stephen, can you please paste the code here?
LikeLike
Excellent work!
I have used for own data which may be filtered interactively. This may leave a node with no connection, if filter is strong. I have three columns of nodes, each node fixed by layer-option 0, 1 or 2. This works fine, until one node of the center column has no connection. In this case it is displayed in column 3 (=layer 2), while it is attributed with layer 1. Any idea how to fix nodes in their ciolumn, if no connection is active? Thank you.
LikeLike
Hi Chris, see my reply to Dean below, just fixed this!
LikeLike
Excellent work!
I have used for own data which may be filtered interactively. This may leave a node with no connection, if filter is strong. I have three columns of nodes, each node fixed by layer-option 0, 1 or 2. This works fine, until one node of the center column has no connection. In this case it is displayed in column 3 (=layer 2), while it is attributed with layer 1. Any idea how to fix nodes in their ciolumn, if no connection is active? Thank you.
LikeLiked by 1 person
Hi deranderegollum, see my reply to Dean below, just fixed this!
LikeLike
Great job on the sankey diagram, Im having issues with the layers. Its seems they are not adhered to.
If you use:
{“sankey”:{“nodes”:[{“name”:”Oil”,”layer”:0},{“name”:”Natural Gas”,”layer”:1},{“name”:”Coal”,”layer”:2},{“name”:”Wind”,”layer”:3}],”links”:[{“source”:0,”target”:1,”value”:15},{“source”:0,”target”:2,”value”:20},{“source”:0,”target”:3,”value”:25}]},”params”:[0.5,0.25,0,0,0]}
The node on layer 0 is correct the rest all go to the right most layer?
LikeLike
Hi Dean – you cannot have “floating” layers – that is, if a node does not have an outflow it will automatically go to the rightmost. You can still place them manually though and save the layout as a workaround…
LikeLike
Or you could, in theory use a dummy link going from say Gas to Coal, but it wont work with exactly a 0 value, it has to be positive. So, unfortunately, it will still show.
LikeLike
UPDATE: just added this functionality, now it should render correclty
LikeLike
Thanks for the functionality… A nice feature to add would be “Layer” headings… I have done this on my local version and works well… Along with links and nodes, I added layers, simple object array with a name attribute… Just as a heads up, the double click doesnt work… If you remove the drag “on” bindings it works again…
LikeLiked by 1 person
Hey, thank you for sharing this great app. I would like to set up different colors for each flow. I have seen some explanations about JSON but don’t know how it works. Can you help me ?
LikeLike
Hi Chloe, just use the fill like for nodes.
LikeLike
Hello Denes, I join to all who thanks for the support open source philosophy (our product BigARTM). We are wonder if it is possible to change the links’s width on source and target separately?
Thanks for your contribution in ecology.
LikeLike
Many thanks for sharing this great tool. Is it possible to increase the resolution of the saved png, or save it an svg?
LikeLike
Hi I have ben entering and re-entering the code for a Sankey.
Once I have all the boxes filled and copied into the Load window, then what?
Whenever I click Save or Draw it seems to automatically revert back to the sample data that was previously there?
What am I missing?
Very frustrating.
LikeLike
Hi Suzanne, try to check “save layout”.
LikeLike
Hi there!
I’m trying to use your component. I see in the demo it works great. Exactly what I need…but…I can’t make it working on my way. I have some problems with “layout” and “paths”.
d3.v3.min.js:1 Error: attribute d: Expected number, “MNaN,NaN CNaN,NaN…”.
I’m trrying to use your “change” function but maybe I need something more. I have the nodes and links arrays ok…
…not sure what happens….
LikeLike
Sorry…already running.
But, the function initializeNodeDepth in the sankey.js, the variable ky always returns negative value 😦
LikeLike
Thanks, let me check that !
LikeLike
Hi Juan – can you give me more info? 🙂
LikeLike
Hello. This looks great! I am trying to load data but when I paste the data into the load window and click “done” I do not see the new data in the input windows. I have tried with both Chrome and IE with no success. Do you have any suggestions?
Thank you,
Erik
LikeLike
This is a great tool, and thank you for publishing it. I do have a few questions:
1) Is it possible to specify the font face used in labels?
2) Is it possible to make the width of nodes (e.g. horizontal measurement) thinner? I would like my intermediate nodes to be more like vertical lines than rectangles.
3) Is it possible to force small nodes to show labels or scale other nodes larger so that the smallest node is still large enough to show labels?
LikeLike
Hi Perry. All of that is possible. But you will have to edit the source JS code. Have you done that before? Otherwise I can try to add some shortcuts over the weekend.
LikeLike
Excellent work on the SanKey graphing! 🙂
Everything is working fine, except one small detail.
I have some sourcenodes on the left layer that does not connect to a targetnode on the right. I still want them to show in the left layer, but as for now, they are not visible.
All the target nodes are showing, even though some of them don’t are connected to a source node.
I tried to set up some dummy links, but that didn’t help 🙂
LikeLike
Hi @danieldybsland. For the empty nodes to show up correctly you have specify a
valueexplicitly. So the node would like this:{"name":"Node","value":7}LikeLike
Ah, you’re right, this is a bug. If you put
layer:0the node jumps to the target layer..LikeLike
Ehi Dénes, I just would like to thank so much you for this tool, it is really amazing!!
Only small downside, the quality of the exported picture is quite low.
Thank you again, Susanna
LikeLike
Thank Susanna! I’ll look into that
LikeLike
Hmm, I see that the font changes back to default, but that is actually a `canvas` problem, so it will involve a larger fix. I’ve flagged this.
LikeLike
Hello Denes, Thank you for your perfect tool. I found a problem. please load this string. As you can see the change in the density has a problem. please lower the density and check what happens.
{“sankey”:{“nodes”:[{“name”:”EV 1″},{“name”:”Separator 1″},{“name”:”Separator 2″},{“name”:”EV 2″},{“name”:”Geo fluid [out]”,”layer”:2},{“name”:”Turbine”},{“name”:”Condenser”},{“name”:”Cooling set”},{“name”:”Pump”},{“name”:”Geo fluid [in]”},{“name”:”ED-Separator 1″},{“name”:”ED-Separator 2″},{“name”:”ED-EV 1″},{“name”:”ED-EV 2″},{“name”:”ED-Turbine”},{“name”:”ED-Condenser”},{“name”:”ED-cooling set”},{“name”:”Power”},{“name”:”Warm water”},{“name”:”Mixing section”},{“name”:”Warm water”},{“name”:”Cooling demand”},{“name”:”ED-pump”},{“name”:”Net power”}],”links”:[{“source”:9,”target”:0,”value”:6530,”fill”:”blue”},{“source”:0,”target”:1,”value”:6401},{“source”:1,”target”:5,”value”:1559},{“source”:1,”target”:3,”value”:4843},{“source”:3,”target”:2,”value”:4548},{“source”:2,”target”:5,”value”:2258},{“source”:2,”target”:7,”value”:2167},{“source”:5,”target”:6,”value”:1480},{“source”:6,”target”:19,”value”:35.39},{“source”:6,”target”:18,”value”:150.5},{“source”:7,”target”:20,”value”:224.9},{“source”:7,”target”:21,”value”:133.5},{“source”:7,”target”:8,”value”:96.91},{“source”:8,”target”:19,”value”:97.38},{“source”:19,”target”:4,”value”:124.9},{“source”:7,”target”:16,”value”:2082},{“source”:5,”target”:17,”value”:2011},{“source”:17,”target”:7,”value”:369.9},{“source”:6,”target”:15,”value”:1294},{“source”:17,”target”:8,”value”:0.54},{“source”:0,”target”:12,”value”:129},{“source”:3,”target”:13,”value”:295},{“source”:1,”target”:10,”value”:0.1},{“source”:2,”target”:11,”value”:122.5},{“source”:5,”target”:14,”value”:326.2},{“source”:8,”target”:22,”value”:0.08},{“source”:17,”target”:23,”value”:1641}]},”params”:[0.75,0.25,0,0,0],”fixedlayout”:[[150.4,0],[255.20000000000005,0],[561,0],[397.6,0],[999.8,222.5146564324042],[503.4000000000001,239.97818986639015],[750.8000000000001,328.70379253274496],[734.2,0],[983.6,137.0863965350498],[0,0],[399,321.7213218914346],[741,195.74842112515404],[255,278.6059970451118],[496,196.05058523627622],[752,419.99010648314714],[989,329.99999999999994],[982,38],[751.8000000000001,239.48621473900243],[986,406.31186318714543],[1053,156.72528725953254],[983,0],[983,16.756817871872443],[1095,113.9968277055217],[989,253.9251372185775]]}
LikeLike
I just checked. Yes the layout renders, but looks weird and it doesn’t react to any button, new nodes or layering. I looked in the code but no error is raised, so I will have to take a deeper dive..
LikeLike
Hi – is there a way to change the font?
LikeLike
Not yet, but there is an open request for this.
LikeLike
Hi!
Can yountell me how can we make values appear in flows or links. I already tried in the item “counts” but values only appear in the nodules.
I would like to export the diagram showing the link values.
Thanks,
Sílvia
LikeLike
Data is a double-edged sword. Create sankey diagram for one thing, data is extremely valuable and allows you to learn how to improve ads and connect more effectively with your customers. The not-so-good side of data is that it’s incredibly difficult and time-consuming to extract actionable insights from it.
LikeLike
Thank you Dénes Csala for the share, It has been something I have been on a lookout for a while, Sent a virtual(paypal) coffee your way as a thanks from my end ;), Cheers Mate !
LikeLike
Thank you 🌟🌟
LikeLike
Hello Denes, nice work!
A tried to generate the following with 60 nodes, 59 links, but it just comes up blank. I read there shouldn’t be a limit, could you check if there’s something wrong with my structure or other?
https://pastebin.com/yrGrRxDb
Thanks!
Joerg.
LikeLike
Denes,
Thank you for a simple and effective tool. I needed a quick Sankey chart for a presentation and your site allowed me to create it in a few minutes. Lovely!
LikeLiked by 1 person