Click here if you prefer to read this post on Medium.com (9 minute read).
Click here to look at the data visualization only on visualizing.org.
A localized Hungarian version of this post also exists.
In this post we will visualize and examine the religious breakdown of the country of Romania and its historical regions. We find that the 4 regions exhibit 4 different patterns and various levels of diversity. A good way to do this comparison is via RGB colorwheels. You can read more about these in previous posts here and here. We will use the colorwheel for world religions presented in a previous post, adapted for the regions and dominant religions of Romania.
As part of this adaptation, we extend the 3-axis, red–green–blue colorwheel to cater for the dominant religions of the country. The result is a 6-axis colorwheel with the sequence of red–yellow–green–cyan–blue–violet. Then, to each of these colors we attach a religion. Using the statistics of the Romanian National Census Bureau, we can define the dominant religions and aggregate the ones with a smaller number of followers. This process yields the following color-coding:
- Orthodox
- Catholic
- Reformed
- Unitarian | Other protestant
- Other religion | Atheist
- Adventist | Pentecostal
Technical details:
Using this coding, we plot each of the settlements (on a commune administrative resolution) onto the colorwheel. The color (hue) of a data-point (equivalent to the angle on the colorwheel) indicates the dominant religion of the settlement. The brightness of the color (radius) gives the relative dominance when compared to the other religions (There is a caveat when using colorwheels with more than 3 dimensions: while for 3 dimensional colorwheels a 40%-40% share of the two dominant colors gives us an exact indication of the third color, in higher dimensions this needs extra information). All points will lay within the indicated hexagon. For visual guidance, we have shown the diagonals. For points in the vertices, one religion has full relative dominance – 100% of the population follows it. A fully red point indicates a 100% orthodox settlement while a fully yellow point marks a pure catholic commune. Halfway on the diagonal connecting the red and yellow vertices (orange region) lay settlements with a population of half orthodox and half catholic believers. The presence of other religions will result in moving away from this diagonal. When reading the colorwheel, it is important to check the tooltips showing detailed breakdown of the religions and monitor the points placed along the edges and diagonals.
Let us look at the colorwheel of the religions in Romania (interactive infographic, fullscreen):
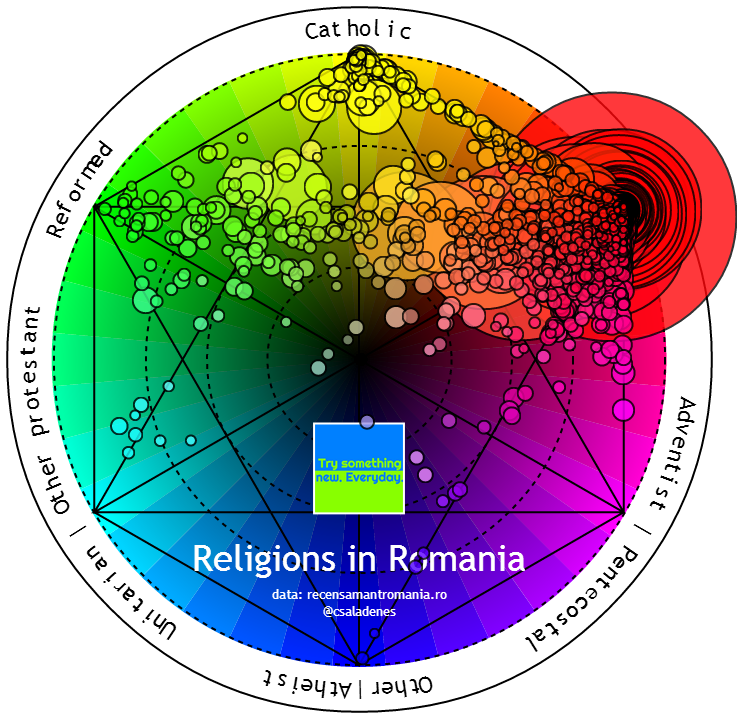
The religions of Romania seem to be clustered into 3 groups. It is clear that the orthodox church is by far the largest, followed by a roughly equal number of catholic and reformed believers. There are also smaller groups of other protestant (mainly unitarian) and adventist/pentecostal (mainly pentecostal) followers, while there are almost no settlements with a dominant religion other than these 5.
The most populated vertex is the red one, meaning that the overwhelming majority of the country contains settlements with a purely orthodox population. There are some points in the yellow vertex as well, meaning that there are some settlements with a purely catholic population. However, the other 4 vertices are unpopulated, meaning that these religions only appear in conjunction with others (with the exception of Ghindaresti, a purely old orthodox commune). Here is is also worth noting that the largest points are almost always located in the red vertex, meaning that almost all of the large cities of the country are all orthodox.
It is interesting to notice that while there are numerous communities lying on the red-yellow and red-violet edges and the red-green diagonal, there are a comparatively smaller number of points on other edges and in regions far from the diagonals. This means that while there are numerous settlements with 2 dominant religions, the balanced presence of 3 or more religions is far more uncommon. Also, while there are blended and balanced catholic-orthodox and reformed-orthodox settlements, this is not true for reformed-catholic communes (the yellow-green edge is empty). Although the number of pentecostal believers is quite high, their highest share within a settlement is 66% and almost all of the dominant pentecostal settlements lie within the red-blue-violet triangle, with a large number of points on the red-violet edge. This means that when pentecostals are in majority then the minority religion is almost always the orthodox, and if a second minority is present, then it is probably not catholic or reformed.
These patterns of mixing of the religions are of course oftentimes due to geographic properties. Let us plot these data-points geocoded onto the map of the country, keeping the color-coding the same (interactive infographic, fullscreen):

We can see that the country’s religious diversity is the highest in the central region (Transylvania), greatly correlated with the settlements of the ethnic minorities of the country, while the other regions are significantly more homogeneous. We can also see that there is a clear phenomenon of clustering, meaning that followers of the same religion tend to live in population blocks, close to each other – also observed in the case of large cities, which are mostly all orthodox. This may not come as surprise, as culture and religion (and maybe even economic performance) are often interlinked concepts. Indeed, the catholics tend to be in majority in Harghita county (central yellow region with a majority Hungarian population) and in some areas of Western Moldavia (yellow clusters in the top right). The reformed followers live in majority in the counties of Covasna, Mures and Bihor, while the unitarians are the majority in the Western part of Harghita county. The religious diversity of the country is therefore the highest in the central part of Romania (a region also called Székelyland by inhabitants), where at least 4 major religions coexist. A comparative diversity can only be observed in the Western part of the country, along the Hungarian border, again due to the presence of ethnic minorities. If we look carefully, we can observe that in Transylvania there is a reddish-violet band extending from the Ukrainian border on the North all the way to the Serbian border in the Southwest, indicating the presence of pentecostal and adventist believers.
Romania’s religious diversity is higher in the central region than in other parts of the country. Therefore let us look at the individual religious colorwheels for each of the historical regions of the country (interactive infographics, fullscreen, click on list items for individual graphs):

Quite surprisingly, the four regions of country exhibit four different patterns!
The colormap of Transylvania is vastly different from the other 3 regions, but it is similar to that of the country, meaning that most of the country’s religious diversity is attributable to this region – consistent with what we found through the geographic analysis as well. Next to the omnipresent fully orthodox settlements, we find communes with populations consisting of entirely or mostly catholic, reformed or unitarian believers. However, contrary to the country-level pattern, we find almost no points on the red-yellow line, corresponding to balanced but exclusively orthodox-catholic cohabitation. The green-yellow edge is bit more populated, but still confined to a handful of settlements. This means that catholic communities only exist alone or together with at least two of the other religions. Also, the isolation of the yellow cluster in the yellow vertex means that there are no communes with 50%-70% catholics, no matter what is the share of other religions – this religion existing only in a localized cluster, or in balanced system of 3 or more religions. This phenomenon is even more pronounced in case of unitarians, where a few communes have an overwhelming majority (>70%) of followers, but in case of other settlements, the unitarians make up less than 30% (and in most cases less than 10%) of the population. This can be interpreted as the demographic analytic of buckling or snap phenomenon. For the case of followers of the reformed religion, there are numerous settlements in which reformed and orthodox believers are in balanced majority (as we can see from the populated red-green diagonal), as well existence in conjunction with other religions (area around the red-green diagonal).
In Moldavia, there are 4 religions present: the majority is orthodox, there is a slightly smaller catholic community, and a small pentecostal and old catholic community. Contrary to the case observed in Transylvania, there are many balanced only catholic-orthodox settlements (remember the observed geography of the catholic clusters in Moldavia along the Siret river). The even more interesting phenomenon is that in Moldavia these settlements are inhabited exclusively by catholics and orthodox’. When looking at the presence of other religions, we notice a hub-and-spoke pattern, meaning that most of the data points lie on the diagonals. This means that next to the dominant orthodox religion, a certain commune has usually only one other religion. This phenomenon becomes apparent when looking at the detailed breakdowns of the communes along the red-violet and red-blue axis, revealing orthodox-pentecostal only and orthodox-old catholic only settlements.
When looking at the map of Dobruja, the dimensionality is further reduced, and we find all settlements laying in the red vertex or on the red-blue diagonal. This means that Dobrujan communes are either fully orthodox, or orthodox believers cohabit with followers of other religions (which in this case is old catholics and muslims). One interesting observation is that while old catholics exhibit the snap property (as in the case of Transylvanian catholics and unitarians), with no settlements with 40%-75% old catholic share and very few with 1%-10%, muslim communities have a more continuous range of shares, but mostly under 20%.
Wallachia is, without doubt, religiously the most compact region of the country. In this region almost all data-points lie in the red vertex, equivalent to many orthodox-only communes. Sporadically there are settlements with comparatively larger catholic, pentecostal and evangelical lutheran believers, but these are the exceptions rather than the norm.
Now why is all this important?
Renowned University of Toronto and NYU professor Richard Florida has just recently explained how religious diversity is likely to lead to economic development. Also, as he quotes, a Harvard study of US counties has found that more religious counties are less innovative and creative. Therefore it is of utmost importance for the long-term economic and cultural sustainability and stability of the country to preserve its religious diversity, and if possible even support more diversification.
I would like to conclude this post with a quote from Dr. Florida’s post:
Many pundits and social scientists continue to discount the economic role of diversity, turning instead to more standard economic variables like technology and education. Those things clearly matter, but the diversity and openness of a society do as well. Our analysis finds that diversity is associated with economic competitiveness, entrepreneurship, and key measures of talent and human capital.
The sources of the open data were the statistics published by the Romanian National Census Bureau and own work. The data has been processed into JSON format with this IPython notebook, with help from pandas. The visualizations have been done entirely in d3.js and the svg language. The source for the Hungarian settlement names is the work of Árpád Varga and own work. The main outcomes are Religions of Romania Colorwheel, the Religions of Romania Colormap, as well regional colorwheels for Transylvania, Wallachia, Moldavia and Dobruja, as well all regions together (static, interactive). If you liked this post or have any questions or thoughts, Like, Share, Comment, and Subscribe!


Bravo… Mult har!
LikeLike
Multumesc! 🙂
LikeLike
This post has been featured by KANTAR Information is Beautiful Awards
LikeLike
Excellent idea with the color-wheel, especially the regional ones. My one big suggestion would be to lower the saturation of the visualizations. The colors are too bright as they are now.
LikeLike
Thanks Arnold! Thanks for the advice, actually, they used to be paler, but I changed them for some reason! Megvan magyarul is 🙂
LikeLike
That looks better imo.
Most láttam hogy van magyarul is. 🙂
Kár hogy nem irtáll az angol cikkbe Székelyföldröl is egy picit.
LikeLike
“religious diversity is likely to lead to economic development” – I’m not saying it’s not like that, but have you ever thought that a citizen living a simple life might be more fulfilled than one living in a big metropolis, doing 1-2 hours each day to get to work and having very few time for spending with his dearest?
LikeLiked by 1 person