Click here if you prefer to read this post on Medium.com (5 minute read).
Click here to look at the data visualization only on visualizing.org.
In this post I have rekindled one of my earlier data analysis and visualization projects from last year, about my explorations of conflict and insurgence dynamics using data from the GDELT event dataset and a simple epidemiological SIR model. The data visualization was done in Matlab, so it is a bit chunky, but please go ahead and check it out here.
Last year, I have started writing a paper about my the results of my exploration, but it is not ready yet. Meanwhile, here are the brief findings.
While the social dynamics that may drive social unrest events have been extensively studied recently and the general patterns regarding the distribution of event-sizes and timings are well-known, I tried to delve deeper into the problem and attempt to gain an insight into individual event dynamics. Using an event classification based on news reports from the Global Database of Events, Language and Tone (GDELT), I looked at social unrest events of different types across different scales and timelines and find that there is an underlying repetitive pattern in their dynamic. Using this information, I postulated a simple SIR system dynamics model and simulated it for various types of social unrest for the period covered by GDELT, including all armed conflicts and major protests between 1979 and 2014. I found that the great majority of unrests are characterized by very similar diffusion and decay rates, independent of their place, time or duration, thus implying a scale-free structure. What is even more interesting is that the variation of these parameters is also small when comparing across different unrest types, such as conflicts and nonviolent protests. The Achilles-heel of the analysis is the establishment of the correlation between actual events and the news reports covering them, for which there is limited literature. I tried to demonstrate the validity of this conjecture through semantic mining in Wikipedia and the BBC Country Profiles databases. So far, I found that there might be a possible universality in the dynamics and this could offer extensibility to dynamics disaster relief programs or social gatherings.
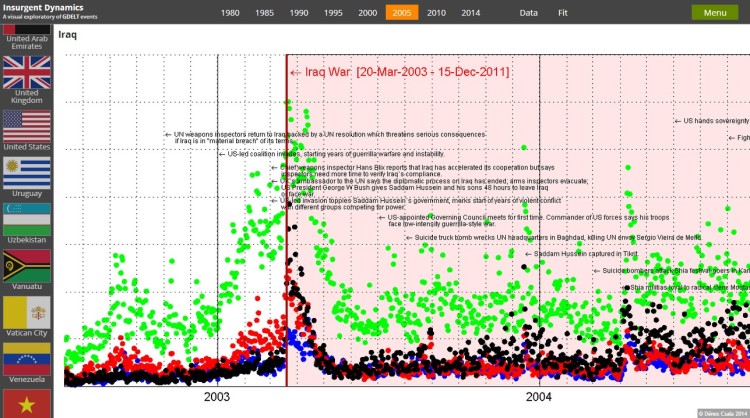
The data exploration website presents large, horizontal timelines for all countries and it visualizes the 4 main GDELT Event datasets:
- Verbal cooperation
- Verbal conflict
- Material cooperation
- Material conflict
Scrolling over the timeline, one can see the major events that were important in the country’s recent history. Conflict or insurgent periods are highlighted – including conflicts in neighboring countries or remote countries but in which the country in question was directly involved.
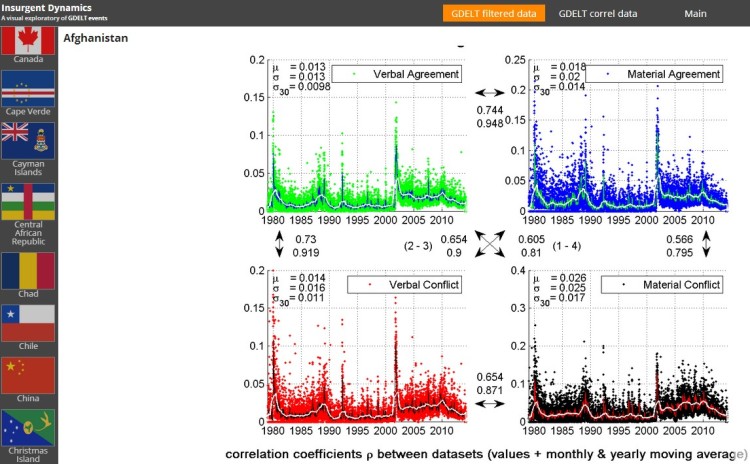
There is a also a mode to visualize the cross-correlations between the 4 datasets.
We can observe that unrest events or conflicts exhibit very similar dynamics, even across different timescales, may this be days, months, years or sometimes even decades. Another more subtle pattern emerges as well – conflicts tend to exhibit 2-3 major cycles and usually the scale of the second cycle is lower than that of the first one. Quite astonishingly, the scale of the peak of this second cycle is about 50% of the first peak in the great majority of the times.
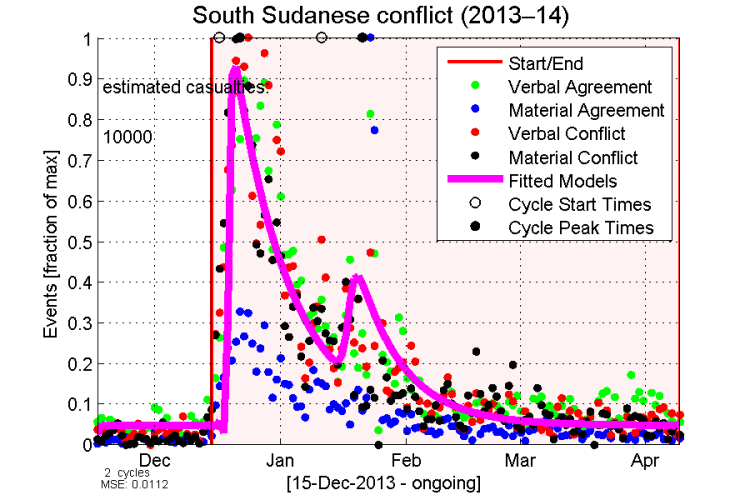
What is even more interesting that this pattern seems to keep returning regardless of the duration of the conflict, or whether we are looking at a small uprising of students or a full-blown war. I have pasted a few representative examples below – without any intention of completeness or selective sampling.
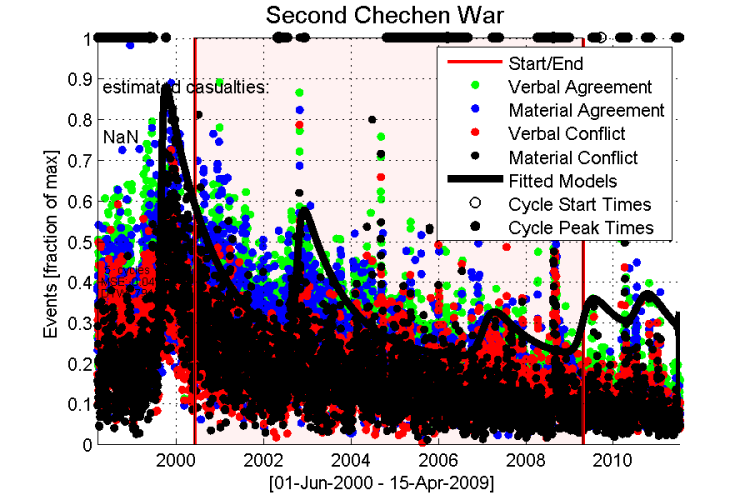
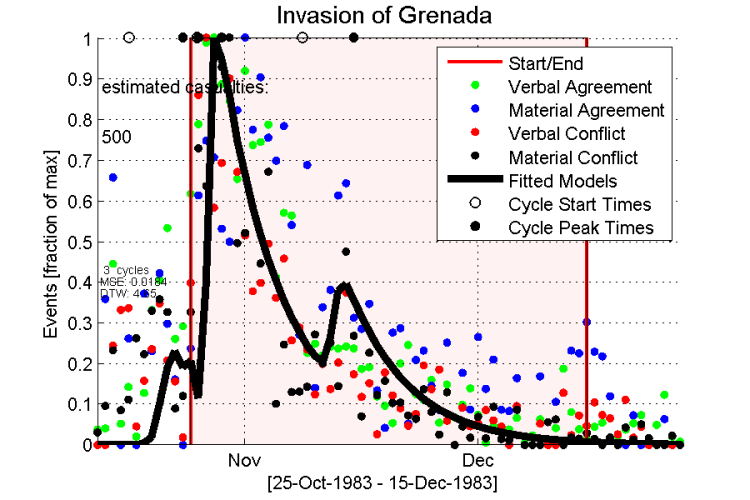
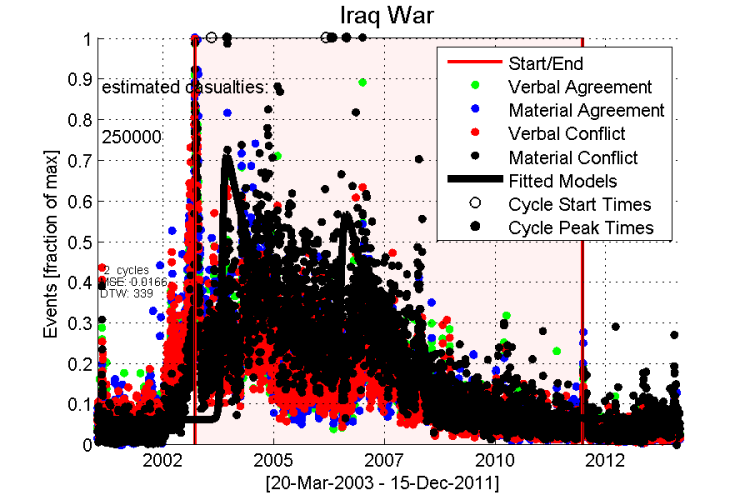
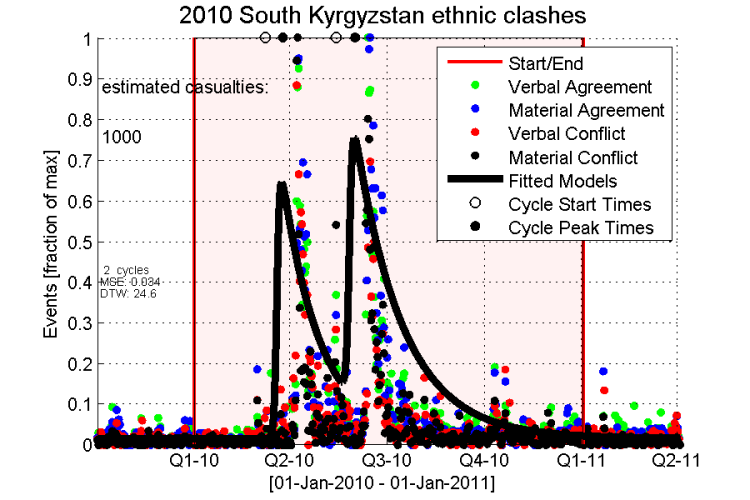
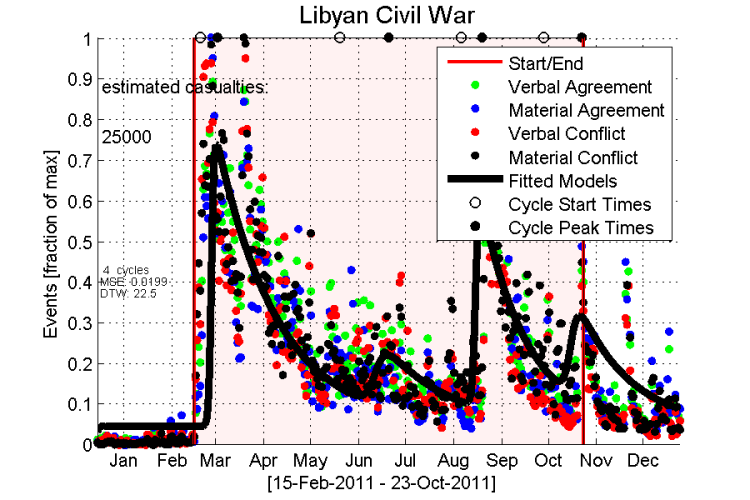
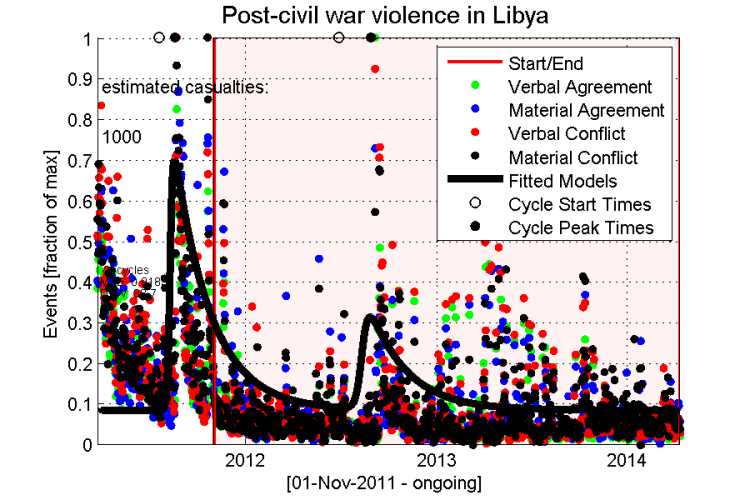
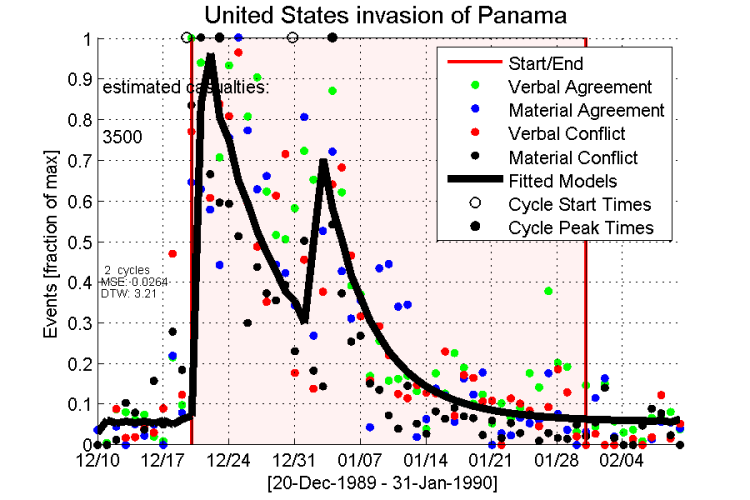
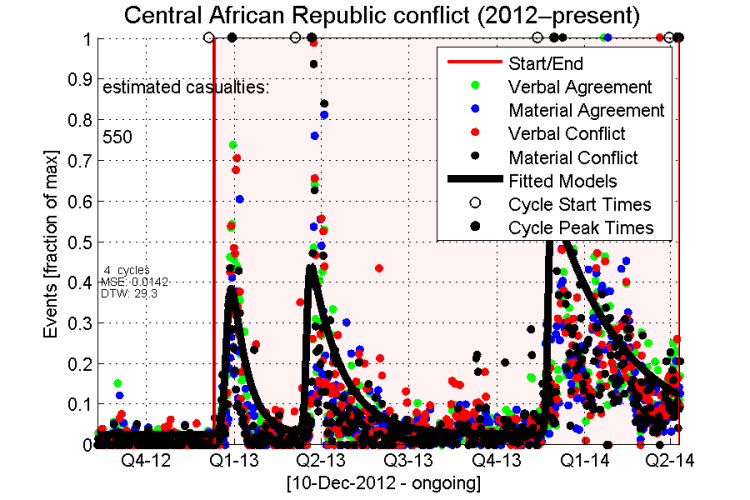
A large number of unrest events are very well described by a pair of two SIV (Susceptible – Insurgent – Veteran, analogous to Susceptible – Infected – Recovered – SIR) cycles: a large, general cycle, typically the outbreak of an insurgency, triggered by some major incident and a second, usually smaller, but sometimes larger (in amplitude) cycle, possibly representing that people are relentless to go back to fighting only once, although this might just be a particularity of data splitting, or unrest start and end designation and classification rules. Another important finding is in the distributions of fits: It seems that the great majority of events are characterized by very similar diffusion and decay rates, independent of their place, time or duration, thus implying a scale-free structure. What is even more interesting is that the variation of these parameters is also small when comparing across different event types, such as conflicts and nonviolent protests.
So I just wanted to share these thoughts, I’ll pick up the writing and finish the paper soon, so stay tuned!
This post describes the analysis and visual data exploratory that I have created when looking at the GDELT Event dataset. The data processing and visualization has been mostly done using Matlab, but I have plans of upgrading it to D3.js. Stay tuned and if you liked this post or have any questions or thoughts, Like, Share, Comment, and Subscribe!


The GDELT project featured this post on their official blog! Thanks guys!
LikeLike
Wonderful analysis. Looking forward to the day we can predict the lifespan of conflicts. You mentioned that the “Achilles-heel” is in establishing correlation between actual events and their news reports. Perhaps one indirect way is to check whether news reports themselves have a constant decay rate for other significant but non-conflict events, such as elections or regional trade negotiations.
LikeLike
True, GDELT does some of that normalizing by default, but its definitely worth looking into it!
LikeLike